Current polling:
Moving average of latest polls for constituency vote:
| Party |
Vote Share (%) |
| SNP |
53.54% |
| Labour |
22.44% |
| Conservative |
13.77% |
| Liberal Democrat |
5.08% |
| Green |
2.03% |
| UKIP |
1.61% |
| Scottish Christian |
0.72% |
| CISTA |
0.22% |
| Scottish Socialist |
0.18% |
| TUSC |
0.12% |
| Solidarity |
0.00% |
(21842 samples over 24 polls)
 |
| Scotland-wide Constituency (First Vote) Voting Intention for Holyrood 2016 |
|
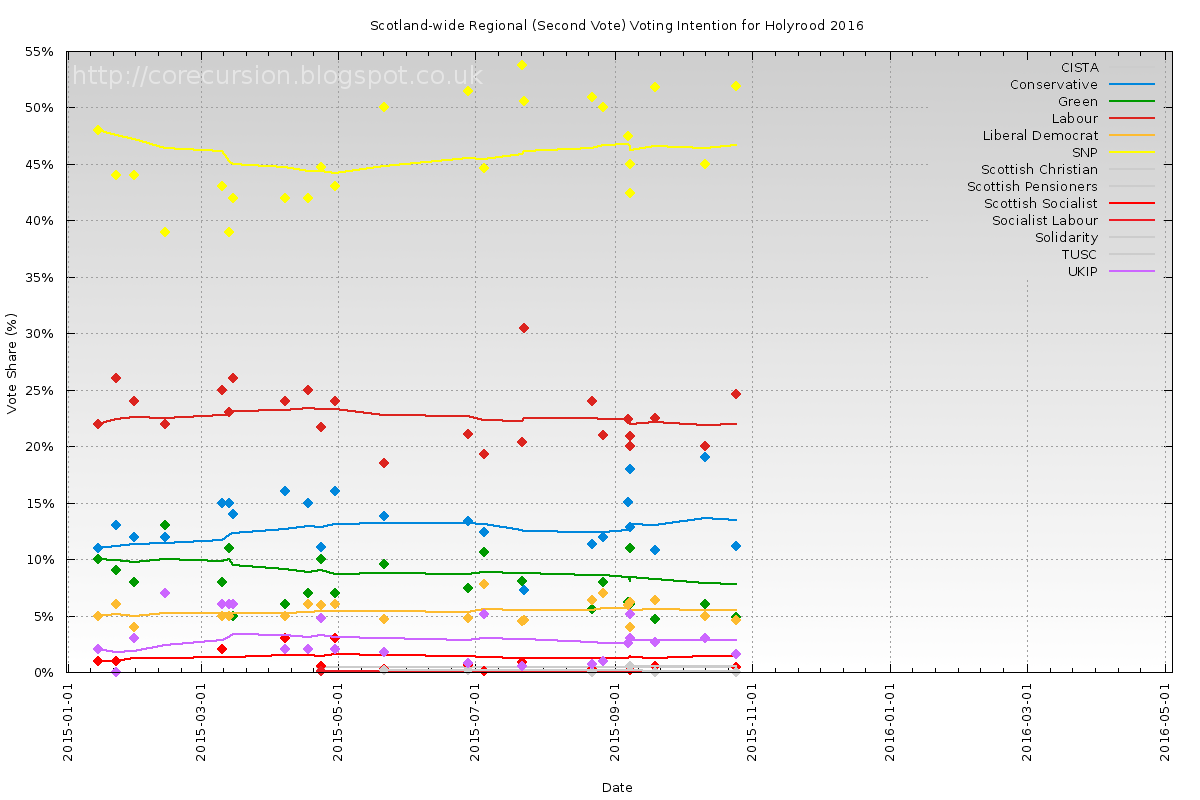
Moving average of latest polls for regional list vote:
| Party |
Vote Share (%) |
| SNP |
46.71% |
| Labour |
22.01% |
| Conservative |
13.48% |
| Green |
7.76% |
| Liberal Democrat |
5.48% |
| UKIP |
2.76% |
| Scottish Socialist |
1.36% |
| TUSC |
0.48% |
| Scottish Christian |
0.36% |
| Solidarity |
0.13% |
| CISTA |
0.12% |
| Socialist Labour |
0.12% |
| Scottish Pensioners |
0.12% |
(21743 samples over 24 polls)
 |
| Scotland-wide Regional (Second Vote) Voting Intention for Holyrood 2016 |
Scotland Overall Summary:
Predicted outcome of Holyrood 2016 election given current polling:
|
SNP |
Labour |
Conservative |
Liberal Democrat |
Green |
Margo MacDonald |
| Constituency Seats |
73 (+20) |
0 (-15) |
0 (-3) |
0 (-2) |
0 (n/c) |
0 (n/c) |
| List Seats |
1 (-15) |
27 (+5) |
14 (+2) |
6 (+3) |
8 (+6) |
0 (-1) |
| Total Seats |
74 (+5) |
27 (-10) |
14 (-1) |
6 (+1) |
8 (+6) |
0 (-1) |
Lothian
|
SNP |
Labour |
Conservative |
Liberal Democrat |
Green |
Margo MacDonald |
| Constituency Seats |
9 (+1) |
0 (-1) |
0 (n/c) |
0 (n/c) |
0 (n/c) |
0 (n/c) |
| List Seats |
0 (n/c) |
3 (n/c) |
1 (-1) |
1 (+1) |
2 (+1) |
0 (-1) |
| Total Seats |
9 (+1) |
3 (-1) |
1 (-1) |
1 (+1) |
2 (+1) |
0 (-1) |
Moving average of poll subsamples for Lothian constituency vote:
| Party |
Vote Share (%) |
| SNP |
49.87% |
| Labour |
24.97% |
| Conservative |
14.24% |
| Liberal Democrat |
6.84% |
| Green |
3.60% |
| Scottish Christian |
1.88% |
| UKIP |
1.30% |
| TUSC |
0.00% |
| Scottish Socialist |
0.00% |
| CISTA |
0.00% |
(967 samples over 9 polls)
 |
| Lothian Constituency (First Vote) Voting Intention for Holyrood 2016 |
Predicted Lothian Constituency results
| Constituency |
2011 Winner |
2016 Prediction |
| Almond Valley |
SNP (54.3%) |
SNP (58.4%) |
| Edinburgh Central |
SNP (32.7%) |
SNP (47.5%) |
| Edinburgh Eastern |
SNP (47.4%) |
SNP (55.4%) |
| Edinburgh Northern & Leith |
Labour (41.6%) |
SNP (51.6%) |
| Edinburgh Pentlands |
SNP (37.3%) |
SNP (48.6%) |
| Edinburgh Southern |
SNP (29.4%) |
SNP (45.5%) |
| Edinburgh Western |
SNP (35.8%) |
SNP (49.4%) |
| Linlithgow |
SNP (49.8%) |
SNP (56.0%) |
| Midlothian North & Musselburgh |
SNP (47.2%) |
SNP (54.2%) |
Moving average of poll subsamples for Lothian regional vote:
| Party |
Vote Share (%) |
| SNP |
40.73% |
| Labour |
21.27% |
| Green |
13.04% |
| Conservative |
11.89% |
| Liberal Democrat |
9.27% |
| UKIP |
3.27% |
| TUSC |
0.63% |
| CISTA |
0.58% |
| Scottish Socialist |
0.43% |
| Solidarity |
0.00% |
| Socialist Labour |
0.00% |
| Scottish Pensioners |
0.00% |
| Scottish Christian |
0.00% |
(980 samples over 9 polls)
 |
| Lothian Regional (Second Vote) Voting Intention for Holyrood 2016 |
Predicted Lothian List Vote share
| Party |
2011 List vote (%) |
Predicted List vote (%) |
| SNP |
39.18% |
40.53% |
| Labour |
24.91% |
20.74% |
| Green |
7.59% |
13.07% |
| Conservative |
11.66% |
12.12% |
| Liberal Democrat |
5.50% |
7.43% |
| UKIP |
0.64% |
2.57% |
| Pensioners |
1.14% |
1.12% |
| Scottish Socialist |
0.42% |
0.88% |
| BNP |
0.70% |
0.69% |
| Others |
0.44% |
0.43% |
| Christian Party |
0.32% |
0.32% |
| Solidarity |
0.12% |
0.05% |
| Socialist Labour |
0.59% |
0.04% |
| Margo MacDonald |
6.79% |
0.00% |
Predicted Lothian additional members:
| # |
2011 Result |
2016 Prediction |
| 1 |
Labour |
Labour |
| 2 |
Conservative |
Green |
| 3 |
Labour |
Conservative |
| 4 |
Green |
Labour |
| 5 |
Margo MacDonald |
Liberal Democrat |
| 6 |
Labour |
Labour |
| 7 |
Conservative |
Green |
West Scotland
|
SNP |
Labour |
Conservative |
Liberal Democrat |
Green |
| Constituency Seats |
10 (+4) |
0 (-4) |
0 (n/c) |
0 (n/c) |
0 (n/c) |
| List Seats |
0 (-2) |
4 (+1) |
2 (n/c) |
0 (n/c) |
1 (+1) |
| Total Seats |
10 (+2) |
4 (-3) |
2 (n/c) |
0 (n/c) |
1 (+1) |
Moving average of poll subsamples for West Scotland constituency vote:
| Party |
Vote Share (%) |
| SNP |
58.07% |
| Labour |
24.12% |
| Conservative |
11.99% |
| Liberal Democrat |
2.68% |
| UKIP |
2.37% |
| Green |
1.58% |
| Scottish Christian |
0.93% |
| Scottish Socialist |
0.87% |
| TUSC |
0.00% |
| CISTA |
0.00% |
(791 samples over 9 polls)
 |
| West Scotland Constituency (First Vote) Voting Intention for Holyrood 2016 |
Predicted West Scotland Constituency results
| Constituency |
2011 Winner |
2016 Prediction |
| Clydebank & Milngavie |
SNP (43.3%) |
SNP (57.2%) |
| Cunninghame North |
SNP (52.6%) |
SNP (61.2%) |
| Cunninghame South |
SNP (49.8%) |
SNP (60.4%) |
| Dumbarton |
Labour (44.1%) |
SNP (53.4%) |
| Eastwood |
Labour (39.7%) |
SNP (45.4%) |
| Greenock & Inverclyde |
Labour (43.9%) |
SNP (56.9%) |
| Paisley |
SNP (42.6%) |
SNP (57.0%) |
| Renfrewshire North & West |
SNP (41.9%) |
SNP (55.6%) |
| Renfrewshire South |
Labour (48.1%) |
SNP (54.6%) |
| Strathkelvin & Bearsden |
SNP (42.2%) |
SNP (56.4%) |
Moving average of poll subsamples for West Scotland regional vote:
| Party |
Vote Share (%) |
| SNP |
50.08% |
| Labour |
25.08% |
| Conservative |
11.22% |
| Green |
7.42% |
| Liberal Democrat |
3.01% |
| UKIP |
2.58% |
| Scottish Christian |
0.83% |
| Scottish Socialist |
0.09% |
| TUSC |
0.00% |
| Solidarity |
0.00% |
| Socialist Labour |
0.00% |
| Scottish Pensioners |
0.00% |
| CISTA |
0.00% |
(790 samples over 9 polls)
 |
| West Scotland Regional (Second Vote) Voting Intention for Holyrood 2016 |
Predicted West Scotland List Vote share
| Party |
2011 List vote (%) |
Predicted List vote (%) |
| SNP |
41.54% |
45.66% |
| Labour |
32.77% |
25.42% |
| Conservative |
12.75% |
12.16% |
| Green |
2.98% |
6.18% |
| Liberal Democrat |
3.24% |
3.11% |
| UKIP |
0.71% |
2.29% |
| Pensioners |
1.69% |
1.61% |
| Scottish Socialist |
0.62% |
1.01% |
| Christian Party |
0.87% |
0.84% |
| BNP |
0.77% |
0.73% |
| Others |
0.73% |
0.69% |
| Independant |
0.16% |
0.16% |
| Solidarity |
0.16% |
0.07% |
| Socialist Labour |
1.01% |
0.07% |
Predicted West Scotland additional members:
| # |
2011 Result |
2016 Prediction |
| 1 |
Conservative |
Labour |
| 2 |
Labour |
Labour |
| 3 |
Conservative |
Conservative |
| 4 |
SNP |
Labour |
| 5 |
Labour |
Labour |
| 6 |
SNP |
Green |
| 7 |
Labour |
Conservative |
South Scotland
|
SNP |
Labour |
Conservative |
Liberal Democrat |
Green |
| Constituency Seats |
9 (+5) |
0 (-2) |
0 (-3) |
0 (n/c) |
0 (n/c) |
| List Seats |
0 (-4) |
3 (+1) |
3 (+3) |
1 (n/c) |
0 (n/c) |
| Total Seats |
9 (+1) |
3 (-1) |
3 (n/c) |
1 (n/c) |
0 (n/c) |
Moving average of poll subsamples for South Scotland constituency vote:
| Party |
Vote Share (%) |
| SNP |
52.20% |
| Conservative |
22.68% |
| Labour |
18.61% |
| Liberal Democrat |
4.75% |
| UKIP |
0.73% |
| Green |
0.46% |
| TUSC |
0.00% |
| Scottish Socialist |
0.00% |
| CISTA |
0.00% |
| Scottish Christian |
0.00% |
(674 samples over 9 polls)
|
| South Scotland Constituency (First Vote) Voting Intention for Holyrood 2016 |
Predicted South Scotland Constituency results
| Constituency |
2011 Winner |
2016 Prediction |
| Ayr |
Conservative (38.9%) |
SNP (47.9%) |
| Carrick, Cumnock & Doon Valley |
SNP (46.2%) |
SNP (54.8%) |
| Clydesdale |
SNP (49.9%) |
SNP (57.9%) |
| Dumfriesshire |
Labour (39.6%) |
SNP (43.5%) |
| East Lothian |
Labour (39.0%) |
SNP (50.9%) |
| Ettrick, Roxburgh & Berwickshire |
Conservative (44.9%) |
SNP (42.6%) |
| Galloway & West Dumfries |
Conservative (36.9%) |
SNP (47.2%) |
| Kilmarnock & Irvine Valley |
SNP (53.2%) |
SNP (58.4%) |
| Midlothian South, Tweeddale & Lauderdale |
SNP (43.5%) |
SNP (54.2%) |
Moving average of poll subsamples for South Scotland regional vote:
| Party |
Vote Share (%) |
| SNP |
49.39% |
| Labour |
17.28% |
| Conservative |
14.45% |
| Liberal Democrat |
8.13% |
| UKIP |
5.11% |
| Green |
4.76% |
| Scottish Pensioners |
1.59% |
| TUSC |
0.00% |
| Scottish Socialist |
0.00% |
| Solidarity |
0.00% |
| Socialist Labour |
0.00% |
| CISTA |
0.00% |
| Scottish Christian |
0.00% |
(687 samples over 9 polls)
|
| South Scotland Regional (Second Vote) Voting Intention for Holyrood 2016 |
Predicted South Scotland List Vote share
| Party |
2011 List vote (%) |
Predicted List vote (%) |
| SNP |
40.98% |
44.98% |
| Labour |
25.32% |
18.56% |
| Conservative |
19.49% |
17.20% |
| Liberal Democrat |
5.41% |
6.72% |
| Green |
3.06% |
4.93% |
| UKIP |
1.16% |
4.20% |
| Pensioners |
1.58% |
1.50% |
| BNP |
0.72% |
0.68% |
| Christian Party |
0.69% |
0.65% |
| Scottish Socialist |
0.25% |
0.39% |
| Solidarity |
0.29% |
0.13% |
| Socialist Labour |
1.04% |
0.07% |
| Independant |
0.00% |
0.00% |
| Others |
0.00% |
0.00% |
Predicted South Scotland additional members:
| # |
2011 Result |
2016 Prediction |
| 1 |
Labour |
Labour |
| 2 |
SNP |
Conservative |
| 3 |
SNP |
Labour |
| 4 |
Labour |
Conservative |
| 5 |
SNP |
Liberal Democrat |
| 6 |
Liberal Democrat |
Labour |
| 7 |
SNP |
Conservative |
Central Scotland
|
SNP |
Labour |
Conservative |
Liberal Democrat |
Green |
| Constituency Seats |
9 (+3) |
0 (-3) |
0 (n/c) |
0 (n/c) |
0 (n/c) |
| List Seats |
0 (-3) |
5 (+2) |
1 (n/c) |
0 (n/c) |
1 (+1) |
| Total Seats |
9 (n/c) |
5 (-1) |
1 (n/c) |
0 (n/c) |
1 (+1) |
Moving average of poll subsamples for Central Scotland constituency vote:
| Party |
Vote Share (%) |
| SNP |
57.71% |
| Labour |
24.77% |
| Conservative |
9.69% |
| Liberal Democrat |
2.70% |
| Green |
2.23% |
| UKIP |
1.15% |
| TUSC |
0.00% |
| Scottish Socialist |
0.00% |
| CISTA |
0.00% |
| Scottish Christian |
0.00% |
(820 samples over 9 polls)
 |
| Central Scotland Constituency (First Vote) Voting Intention for Holyrood 2016 |
Predicted Central Scotland Constituency results
| Constituency |
2011 Winner |
2016 Prediction |
| Airdrie & Shotts |
SNP (50.2%) |
SNP (61.3%) |
| Coatbridge & Chryston |
Labour (52.2%) |
SNP (56.4%) |
| Cumbernauld & Kilsyth |
SNP (53.8%) |
SNP (63.1%) |
| East Kilbride |
SNP (48.0%) |
SNP (59.5%) |
| Falkirk East |
SNP (50.8%) |
SNP (61.3%) |
| Falkirk West |
SNP (55.3%) |
SNP (63.5%) |
| Hamilton, Larkhall & Stonehouse |
SNP (48.1%) |
SNP (59.9%) |
| Motherwell & Wishaw |
Labour (43.8%) |
SNP (54.5%) |
| Uddingston & Bellshill |
Labour (46.1%) |
SNP (57.6%) |
Moving average of poll subsamples for Central Scotland regional vote:
| Party |
Vote Share (%) |
| SNP |
52.77% |
| Labour |
27.53% |
| Conservative |
7.45% |
| Green |
5.92% |
| UKIP |
3.15% |
| Liberal Democrat |
1.78% |
| Scottish Socialist |
0.89% |
| Solidarity |
0.07% |
| TUSC |
0.00% |
| Socialist Labour |
0.00% |
| Scottish Pensioners |
0.00% |
| CISTA |
0.00% |
| Scottish Christian |
0.00% |
(818 samples over 9 polls)
 |
| Central Scotland Regional (Second Vote) Voting Intention for Holyrood 2016 |
Predicted Central Scotland List Vote share
| Party |
2011 List vote (%) |
Predicted List vote (%) |
| SNP |
46.35% |
49.48% |
| Labour |
35.31% |
27.69% |
| Conservative |
6.37% |
6.99% |
| Green |
2.41% |
4.96% |
| Pensioners |
2.48% |
2.40% |
| UKIP |
0.54% |
2.33% |
| Liberal Democrat |
1.42% |
1.59% |
| Christian Party |
1.36% |
1.31% |
| Scottish Socialist |
0.35% |
0.99% |
| BNP |
0.95% |
0.92% |
| Others |
0.81% |
0.78% |
| Independant |
0.35% |
0.34% |
| Solidarity |
0.24% |
0.14% |
| Socialist Labour |
1.06% |
0.07% |
Predicted Central Scotland additional members:
| # |
2011 Result |
2016 Prediction |
| 1 |
Labour |
Labour |
| 2 |
Labour |
Labour |
| 3 |
SNP |
Labour |
| 4 |
Conservative |
Conservative |
| 5 |
Labour |
Labour |
| 6 |
SNP |
Labour |
| 7 |
SNP |
Green |
Mid Scotland and Fife
|
SNP |
Labour |
Conservative |
Liberal Democrat |
Green |
| Constituency Seats |
9 (+1) |
0 (-1) |
0 (n/c) |
0 (n/c) |
0 (n/c) |
| List Seats |
0 (-1) |
3 (n/c) |
2 (n/c) |
1 (n/c) |
1 (+1) |
| Total Seats |
9 (n/c) |
3 (-1) |
2 (n/c) |
1 (n/c) |
1 (+1) |
Moving average of poll subsamples for Mid Scotland and Fife constituency vote:
| Party |
Vote Share (%) |
| SNP |
53.60% |
| Labour |
21.62% |
| Conservative |
13.80% |
| Liberal Democrat |
6.68% |
| UKIP |
2.00% |
| Green |
1.52% |
| CISTA |
0.89% |
| TUSC |
0.00% |
| Scottish Socialist |
0.00% |
| Scottish Christian |
0.00% |
(739 samples over 9 polls)
 |
| Mid Scotland and Fife Constituency (First Vote) Voting Intention for Holyrood 2016 |
Predicted Mid Scotland and Fife Constituency results
| Constituency |
2011 Winner |
2016 Prediction |
| Clackmannanshire & Dunblane |
SNP (48.3%) |
SNP (57.4%) |
| Cowdenbeath |
Labour (46.5%) |
SNP (54.2%) |
| Dunfermline |
SNP (37.6%) |
SNP (52.8%) |
| Kirkcaldy |
SNP (45.2%) |
SNP (56.4%) |
| Mid Fife & Glenrothes |
SNP (52.3%) |
SNP (58.8%) |
| North East Fife |
SNP (37.2%) |
SNP (50.6%) |
| Perthshire North |
SNP (60.8%) |
SNP (61.8%) |
| Perthshire South & Kinross-shire |
SNP (51.5%) |
SNP (57.6%) |
| Stirling |
SNP (48.9%) |
SNP (56.9%) |
Moving average of poll subsamples for Mid Scotland and Fife regional vote:
| Party |
Vote Share (%) |
| SNP |
49.26% |
| Labour |
21.44% |
| Conservative |
14.55% |
| Liberal Democrat |
6.48% |
| Green |
5.22% |
| UKIP |
2.24% |
| Socialist Labour |
1.10% |
| Solidarity |
0.69% |
| TUSC |
0.00% |
| Scottish Socialist |
0.00% |
| Scottish Pensioners |
0.00% |
| CISTA |
0.00% |
| Scottish Christian |
0.00% |
(740 samples over 9 polls)
 |
| Mid Scotland and Fife Regional (Second Vote) Voting Intention for Holyrood 2016 |
Predicted Mid Scotland and Fife List Vote share
| Party |
2011 List vote (%) |
Predicted List vote (%) |
| SNP |
45.20% |
46.30% |
| Labour |
25.03% |
20.19% |
| Conservative |
14.12% |
14.25% |
| Green |
4.23% |
6.03% |
| Liberal Democrat |
5.85% |
6.03% |
| UKIP |
1.10% |
2.64% |
| Pensioners |
1.59% |
1.47% |
| BNP |
0.67% |
0.62% |
| Socialist Labour |
0.69% |
0.58% |
| Independant |
0.57% |
0.52% |
| Scottish Socialist |
0.32% |
0.49% |
| Solidarity |
0.08% |
0.37% |
| Christian Party |
0.30% |
0.28% |
| Others |
0.25% |
0.23% |
Predicted Mid Scotland and Fife additional members:
| # |
2011 Result |
2016 Prediction |
| 1 |
Conservative |
Labour |
| 2 |
Labour |
Conservative |
| 3 |
Labour |
Labour |
| 4 |
Conservative |
Conservative |
| 5 |
Labour |
Labour |
| 6 |
Liberal Democrat |
Green |
| 7 |
SNP |
Liberal Democrat |
Highlands and Islands
|
SNP |
Labour |
Conservative |
Liberal Democrat |
Green |
| Constituency Seats |
8 (+2) |
0 (n/c) |
0 (n/c) |
0 (-2) |
0 (n/c) |
| List Seats |
0 (-3) |
2 (n/c) |
2 (n/c) |
2 (+2) |
1 (+1) |
| Total Seats |
8 (-1) |
2 (n/c) |
2 (n/c) |
2 (n/c) |
1 (+1) |
Moving average of poll subsamples for Highlands and Islands constituency vote:
| Party |
Vote Share (%) |
| SNP |
58.50% |
| Labour |
16.55% |
| Conservative |
9.64% |
| Liberal Democrat |
9.43% |
| Scottish Christian |
4.35% |
| UKIP |
1.25% |
| Green |
1.13% |
| TUSC |
0.00% |
| Scottish Socialist |
0.00% |
| CISTA |
0.00% |
(534 samples over 9 polls)
 |
| Highlands and Islands Constituency (First Vote) Voting Intention for Holyrood 2016 |
Predicted Highlands and Islands Constituency results
| Constituency |
2011 Winner |
2016 Prediction |
| Argyll & Bute |
SNP (50.6%) |
SNP (59.7%) |
| Caithness Sutherland & Ross |
SNP (48.4%) |
SNP (61.1%) |
| Inverness & Nairn |
SNP (51.5%) |
SNP (60.7%) |
| Moray |
SNP (58.8%) |
SNP (63.1%) |
| Nah h-Eilanan an Iar |
SNP (65.3%) |
SNP (68.8%) |
| Orkney Islands |
Liberal Democrat (35.7%) |
SNP (41.1%) |
| Shetland Islands |
Liberal Democrat (47.5%) |
SNP (32.8%) |
| Skye, Lochaber & Badenoch |
SNP (46.2%) |
SNP (59.6%) |
Moving average of poll subsamples for Highlands and Islands regional vote:
| Party |
Vote Share (%) |
| SNP |
37.02% |
| Labour |
17.27% |
| Green |
12.73% |
| Liberal Democrat |
12.67% |
| Conservative |
11.43% |
| UKIP |
6.10% |
| Scottish Christian |
2.95% |
| TUSC |
0.00% |
| Scottish Socialist |
0.00% |
| Solidarity |
0.00% |
| Socialist Labour |
0.00% |
| Scottish Pensioners |
0.00% |
| CISTA |
0.00% |
(507 samples over 9 polls)
 |
| Highlands and Islands Regional (Second Vote) Voting Intention for Holyrood 2016 |
Predicted Highlands and Islands List Vote share
| Party |
2011 List vote (%) |
Predicted List vote (%) |
| SNP |
47.53% |
40.87% |
| Labour |
14.46% |
13.94% |
| Liberal Democrat |
12.14% |
11.99% |
| Conservative |
11.64% |
11.34% |
| Green |
5.07% |
10.32% |
| UKIP |
1.88% |
5.57% |
| Christian Party |
1.98% |
1.77% |
| Others |
1.93% |
1.73% |
| Pensioners |
1.55% |
1.39% |
| BNP |
0.63% |
0.57% |
| Scottish Socialist |
0.28% |
0.42% |
| Socialist Labour |
0.79% |
0.05% |
| Solidarity |
0.11% |
0.05% |
| Independant |
0.00% |
0.00% |
Predicted Highlands and Islands additional members:
| # |
2011 Result |
2016 Prediction |
| 1 |
Labour |
Labour |
| 2 |
Conservative |
Liberal Democrat |
| 3 |
Labour |
Conservative |
| 4 |
SNP |
Green |
| 5 |
SNP |
Labour |
| 6 |
Conservative |
Liberal Democrat |
| 7 |
SNP |
Conservative |
North East Scotland
|
SNP |
Labour |
Conservative |
Liberal Democrat |
Green |
| Constituency Seats |
10 (n/c) |
0 (n/c) |
0 (n/c) |
0 (n/c) |
0 (n/c) |
| List Seats |
1 (n/c) |
2 (-1) |
2 (n/c) |
1 (n/c) |
1 (+1) |
| Total Seats |
11 (n/c) |
2 (-1) |
2 (n/c) |
1 (n/c) |
1 (+1) |
Moving average of poll subsamples for North East Scotland constituency vote:
| Party |
Vote Share (%) |
| SNP |
61.50% |
| Labour |
17.94% |
| Conservative |
15.28% |
| Liberal Democrat |
3.68% |
| Green |
1.38% |
| UKIP |
0.86% |
| TUSC |
0.00% |
| Scottish Socialist |
0.00% |
| CISTA |
0.00% |
| Scottish Christian |
0.00% |
(813 samples over 9 polls)
 |
| North East Scotland Constituency (First Vote) Voting Intention for Holyrood 2016 |
Predicted North East Scotland Constituency results
| Constituency |
2011 Winner |
2016 Prediction |
| Aberdeen Central |
SNP (40.0%) |
SNP (56.4%) |
| Aberdeen Donside |
SNP (55.3%) |
SNP (63.4%) |
| Aberdeen South & North Kincardine |
SNP (41.7%) |
SNP (54.9%) |
| Aberdeenshire East |
SNP (64.5%) |
SNP (67.8%) |
| Aberdeenshire West |
SNP (42.6%) |
SNP (57.6%) |
| Angus North & Mearns |
SNP (54.8%) |
SNP (62.5%) |
| Angus South |
SNP (58.5%) |
SNP (62.6%) |
| Banffshire & Buchan Coast |
SNP (67.2%) |
SNP (68.2%) |
| Dundee City East |
SNP (64.2%) |
SNP (67.8%) |
| Dundee City West |
SNP (57.6%) |
SNP (65.4%) |
Moving average of poll subsamples for North East Scotland regional vote:
| Party |
Vote Share (%) |
| SNP |
55.47% |
| Labour |
15.71% |
| Conservative |
13.64% |
| Green |
7.16% |
| Liberal Democrat |
3.95% |
| UKIP |
3.57% |
| TUSC |
2.36% |
| Scottish Socialist |
0.34% |
| Solidarity |
0.00% |
| Socialist Labour |
0.00% |
| Scottish Pensioners |
0.00% |
| CISTA |
0.00% |
| Scottish Christian |
0.00% |
(802 samples over 9 polls)
 |
| North East Scotland Regional (Second Vote) Voting Intention for Holyrood 2016 |
Predicted North East Scotland List Vote share
| Party |
2011 List vote (%) |
Predicted List vote (%) |
| SNP |
52.71% |
52.77% |
| Labour |
16.44% |
14.00% |
| Conservative |
14.11% |
13.73% |
| Green |
3.90% |
6.68% |
| Liberal Democrat |
6.81% |
5.22% |
| UKIP |
0.93% |
3.04% |
| Pensioners |
1.66% |
1.51% |
| Scottish Socialist |
0.42% |
0.79% |
| Christian Party |
0.81% |
0.74% |
| BNP |
0.72% |
0.66% |
| Independant |
0.44% |
0.41% |
| Others |
0.42% |
0.38% |
| Solidarity |
0.11% |
0.05% |
| Socialist Labour |
0.55% |
0.04% |
Predicted North East Scotland additional members:
| # |
2011 Result |
2016 Prediction |
| 1 |
Labour |
Labour |
| 2 |
Conservative |
Conservative |
| 3 |
Labour |
Labour |
| 4 |
Conservative |
Conservative |
| 5 |
Liberal Democrat |
Green |
| 6 |
Labour |
Liberal Democrat |
| 7 |
SNP |
SNP |
Glasgow
|
SNP |
Labour |
Conservative |
Liberal Democrat |
Green |
| Constituency Seats |
9 (+4) |
0 (-4) |
0 (n/c) |
0 (n/c) |
0 (n/c) |
| List Seats |
0 (-2) |
5 (+2) |
1 (n/c) |
0 (n/c) |
1 (n/c) |
| Total Seats |
9 (+2) |
5 (-2) |
1 (n/c) |
0 (n/c) |
1 (n/c) |
Moving average of poll subsamples for Glasgow constituency vote:
| Party |
Vote Share (%) |
| SNP |
55.83% |
| Labour |
26.53% |
| Conservative |
8.91% |
| Liberal Democrat |
4.21% |
| Green |
3.52% |
| Scottish Socialist |
0.94% |
| TUSC |
0.89% |
| UKIP |
0.85% |
| CISTA |
0.77% |
| Scottish Christian |
0.00% |
(772 samples over 9 polls)
 |
| Glasgow Constituency (First Vote) Voting Intention for Holyrood 2016 |
Predicted Glasgow Constituency results
| Constituency |
2011 Winner |
2016 Prediction |
| Glasgow Anniesland |
SNP (43.2%) |
SNP (56.1%) |
| Glasgow Cathcart |
SNP (45.5%) |
SNP (56.9%) |
| Glasgow Kelvin |
SNP (43.3%) |
SNP (56.1%) |
| Glasgow Maryhill & Springburn |
Labour (48.1%) |
SNP (56.0%) |
| Glasgow Pollok |
Labour (47.5%) |
SNP (57.5%) |
| Glasgow Provan |
Labour (52.3%) |
SNP (56.0%) |
| Glasgow Shettleston |
SNP (47.8%) |
SNP (59.0%) |
| Glasgow Southside |
SNP (54.4%) |
SNP (61.9%) |
| Rutherglen |
Labour (46.1%) |
SNP (53.8%) |
Moving average of poll subsamples for Glasgow regional vote:
| Party |
Vote Share (%) |
| SNP |
45.26% |
| Labour |
25.67% |
| Green |
10.90% |
| Conservative |
9.38% |
| Liberal Democrat |
4.18% |
| UKIP |
3.05% |
| CISTA |
1.87% |
| Scottish Socialist |
1.38% |
| TUSC |
0.93% |
| Solidarity |
0.00% |
| Socialist Labour |
0.00% |
| Scottish Pensioners |
0.00% |
| Scottish Christian |
0.00% |
(785 samples over 9 polls)
 |
| Glasgow Regional (Second Vote) Voting Intention for Holyrood 2016 |
Predicted Glasgow List Vote share
| Party |
2011 List vote (%) |
Predicted List vote (%) |
| SNP |
39.82% |
41.39% |
| Labour |
34.99% |
25.94% |
| Green |
5.97% |
10.16% |
| Conservative |
6.11% |
7.61% |
| Others |
4.45% |
4.13% |
| Liberal Democrat |
2.55% |
3.26% |
| UKIP |
0.54% |
2.22% |
| Pensioners |
1.80% |
1.67% |
| Scottish Socialist |
0.65% |
1.65% |
| BNP |
1.16% |
1.08% |
| Christian Party |
0.72% |
0.67% |
| Independant |
0.16% |
0.15% |
| Socialist Labour |
1.09% |
0.07% |
| Solidarity |
0.00% |
0.00% |
Predicted Glasgow additional members:
| # |
2011 Result |
2016 Prediction |
| 1 |
Labour |
Labour |
| 2 |
SNP |
Labour |
| 3 |
Conservative |
Green |
| 4 |
Green |
Labour |
| 5 |
Labour |
Conservative |
| 6 |
SNP |
Labour |
| 7 |
Labour |
Labour |